This study tests the hypotheses outlined in Cloudfindings (2024). An online survey (n=60) was conducted to test these hypotheses, using PsyToolkit (Stoet 2010, 2017). The hypotheses were supported by the data. Further discussion will be included in future posts.
Variables
Scales by other authors
Tromso Social Intelligence Scale (TSIS): Measures the concept of social intelligence, with three factors - social information processing, social skills, and social awareness. (Silvera et al. 2021)
Interpersonal Reactivity Index (IRI): Measures four factors of empathy, the empathic concern subscale being used in this study to measure emotional empathy. (Davis 1980)
Levenson Self Report Psychopathy (LSRP): Measures two factors of psychopathy, primary and secondary. (Levenson et al. 1995)
Ritvo Autism-Asperger Diagnostic Scale (RAADS-14): A short screening measure for autism (Eriksson et al. 2013)
Short Oxford-Liverpool Inventory of Feelings and Experiences (O-LIFE): A brief version of the original O-LIFE that measures 4 dimensions of schizotypy - the Unusual Experiences and Impulsive Nonconformity factors were used in this study. (Mason et al. 2005)
Schizotypal Personality Questionnaire Brief-Revised (SPQ-BR): A measure of schizotypy with three factors, the disorganized factor was used in this study (Cohen et al. 2013)
Yale-Brown Obsessive Compulsive Scale (Y-BOCS): A scale to measure symptoms of obsessive compulsive disorder. This was used in a previous study that has not been published, and a factor analysis resulted in three factors, and the three top loading items on each were used in this study to measure obsessive compulsive traits (Storch et al. 2010)
Ten Item Personality Inventory (TIPI): A measure of the big-five personality traits that is very brief (Gosling et al. 2003)
Moral Foundations Questionnaire 30 (MFQ30): A measure of 6 domains of moral values. To minimize study length, only the three items for each scale coded in an agree-disagree format were used. (Graham et al. 2009)
Cloudfindings Scales
Literal Language Scale: A measure of theory of mind and autistic traits focusing on theory of mind impairments specific to autism (Cloudfindings 2021)
Autistic Interests Scale: A measure of autistic traits focusing on repetitive behaviors and obsessive behaviors specific to autism (Cloudfindings 2022a)
OcPD Scale: A short measure of obsessive compulsive personality disorder traits with one item corresponding to each diagnostic criterion (Cloudfindings 2022b)
Scales Created for the Current Study
Humanism/Unconditional Empathy - This scale was created to measure traits related to unconditional empathy, unconditional understanding, forgiveness, identification with all humans, and a lack of personal punitive desires toward other people. This scale was validated, all items loading highly on the first extracted principal component, and the component scores were used in the analyses [Table 1]
Table 1
I am interested in the real reasons that made someone do something | 0.546 |
I am friends with people that most would consider weird or bad | 0.323 |
I forgive those who hurt me | 0.702 |
{reverse} If someone caused someone else to suffer, I would want that person to suffer | 0.384 |
{reverse} People who do bad things only pretend to feel bad about them | 0.343 |
I generally try to be nice to everyone | 0.128 |
I am willing to help those who most don’t want to help | 0.512 |
{reverse} If a person keeps making bad choices, I won’t continue to support them | 0.430 |
{reverse} I know that I could never do the things some other people do, even if I was in the same position | 0.360 |
I can understand pretty much everyone | 0.626 |
I want to pick the brains of people who I don’t understand or am afraid of | 0.519 |
I can feel angry at someone momentarily, but not hate them | 0.557 |
I generally wish everyone has a good life, even if they don’t really deserve it | 0.609 |
Moral absolutism - This scale measured moral absolutist tendencies regardless of political orientation irrespective of political affiliation, and included things like equating shared identity and beliefs with moral correctness, belief in “good” and “bad” people, support for censorship, etc. This scale included items from a previous unpublished study that found a moral absolutism factor. The scale was validated through principal components analysis, all except 2 items loading in the expected direction - the extracted component was used to measure moral absolutism. [Table 2]
Table 2
{reverse} There is no such thing as a “good” or “bad” person | 0.613 |
A person's beliefs reflect how moral they are | 0.620 |
Some beliefs should not be tolerated in our society | 0.632 |
People with opposing beliefs usually need to be educated | 0.410 |
Homosexuality is disgusting | 0.525 |
The collective good matters more than the individual | 0.193 |
{reverse} Actions are only wrong if they cause harm | 0.228 |
{reverse} Bad actions have bad intentions | -0.111 |
My identity (gender, ethnicity, nationality) is important to who I am as a person | 0.442 |
Pornography should be banned | 0.618 |
{reverse} Nobody “deserves” anything | 0.225 |
I am confident that my beliefs are correct and will not change | 0.408 |
Humans have souls, or an inherent character that is not purely physical | 0.607 |
I am part of a demographic that is unfairly disadvantaged | 0.055 |
{reverse} People should not be treated differently based on their social group or identity | 0.519 |
Scientists publish biased and fake research to further evil agendas. | 0.354 |
Disgust sensitivity - This scale was created to measure general sensitivity to disgust, with items related to being upset or grossed out by viewing disgusting things (e.g., blood, gore), hearing about disgusting things, disgust related fears, and items related to the general experience of disgust, all items loaded in the expected direction, validating the scale. Component scores were used in the analyses [Table 3].
Table 3
The sight of blood freaks me out | 0.665 |
If I saw a video of someone being killed, it would make me very uncomfortable | 0.694 |
I can’t stand being around people who stink | 0.430 |
I want to look away when I see something gross | 0.835 |
{reverse} I am not grossed out as easily as others | 0.667 |
Hearing about others sexual experiences makes me very uncomfortable | 0.360 |
Most kinks are gross | 0.374 |
I am scared of most bugs | 0.233 |
Seeing someone else sneeze would gross me out | 0.423 |
I would not want to be around a dead body | 0.692 |
I would not want to be around someone who wears the same clothes without washing them | 0.391 |
I can’t stand a mess | 0.476 |
Ostracism-Demonization of Non-conformity/Disgust - This factor was extracted from a scale I made to measure the degree to which individuals are suspicious toward, have negative attitudes toward, and desire to ostracize, avoid, and harm people who do or believe non-conformist or disgusting things - this scale turned out to have two factors (indicated by scree plot), one related to judgment, misunderstanding, and ostracism of non-conforming individuals, and another related to bullying such individuals, which I called bullying of non-conformity/disgust. The varimax rotated factor scores were used in the analyses. [Table 4]
Table 4
| Ostracism | Bullying |
Sometimes, people who get bullied deserve it | -0.139 | 0.769 |
I am wary of people who seem like they might be a weird or bad person | 0.585 | 0.449 |
Messy people are disgusting | 0.076 | 0.598 |
If someone I knew had a morally wrong sexual fantasy, I would never look at them the same | 0.653 | 0.222 |
I would not be friends with someone that enjoys watching gore | 0.722 | -0.174 |
If I found out someone I knew was addicted to illegal drugs, I would not want to be around them anymore | 0.316 | 0.084 |
I am wary of certain beliefs that might indicate the person is bad | 0.736 | 0.337 |
I would feel weird around someone who is HIV positive, even if I didn’t want to | -0.107 | 0.550 |
If a person I knew said things that were unusual and shocking, I would avoid them | 0.676 | -0.304 |
I talk badly about people who are weird and gross | 0.284 | 0.623 |
I notice certain things that people say that tells me there is something bad about them, even if they don’t say it directly | 0.522 | 0.418 |
Someone whose interests are in things controversial, morbid, gross, or weird is someone I would be suspicious of | 0.707 | -0.174 |
If someone defends a group that shouldn’t be defended, the person is likely part of that group | 0.640 | -0.039 |
Looking at ugly or fat people makes me feel unpleasant or angry | -0.001 | 0.781 |
Political correctness - This scale measured politically correct attitudes, such as support for cancel culture, equating intentions with politically correct interpretations, and blank-slate beliefs (i.e., denial of sex differences and heritability). All items loaded highly on the first factor, supporting its validity [Table 5]
Table 5
If a white person says the ‘n’ word, they are racist, no matter the context | 0.841 |
The idea that men and women have biologically based brain differences is outdated pseudoscience | 0.736 |
Intelligence can not be adequately measured by IQ, and is something that is learned, not set in stone | 0.685 |
Gender roles are created by society | 0.746 |
If a non-disabled person says the ‘r’ word, they are ableist, no matter the context | 0.798 |
If any relationship between ethnicity and behavior is found, it is due to societal factors | 0.658 |
Physical traits and personality cannot be linked | 0.383 |
Hate speech isn’t free speech | 0.769 |
I would not be friends with someone who has outdated and harmful beliefs | 0.788 |
Cancel culture is just accountability culture | 0.708 |
Female ingroup bias - This scale measured female ingroup bias, such as the degree to which a person had negative beliefs about men based on sex differences where male behavior is seen as worse than female behavior due it not being female-typical, broad cynical generalizations about male behavior, invalidation of male experiences, tendency to view most men in a negative way, seeing men as inferior and alien, are annoyed by interacting with men, etc. All items loaded highly on the scale, supporting the validity of the scale. Component scores were used in the analyses. [Table 6]
Table 6
The way a lot of men think is disgusting | 0.662 |
Most men frequently subtly try to dominate women in various ways | 0.614 |
I am uncomfortable around most men you never know which one is bad | 0.722 |
Most men think they are smart but they are not | 0.577 |
The way men date shows they lack the capacity to really love someone | 0.802 |
I find most men gross and annoying | 0.709 |
Inappropriate sexual behaviors are some of the worst and most inexcusable actions | 0.538 |
When a man complains about negative experiences in past relationships, it was probably because he abused them in some way | 0.748 |
Men who say they are nice and complain about women not being interested in them are usually just jerks | 0.609 |
I get annoyed when men try to say that they have it harder than women in some way | 0.728 |
When men do bad things, it is usually not for good reasons, but when women do it is usually for a good reason | 0.728 |
Men who are messy or lazy usually expect women to do everything for them | 0.769 |
I enjoy making fun of men | 0.663 |
Men make false claims about biology to try and justify their bad behaviors | 0.715 |
Society is oriented in a way that favors and enables men but not women | 0.593 |
There are almost no good men left in this generation | 0.592 |
There are men who aren’t like the rest, showing that the bad things about men are a moral choice | 0.329 |
A lot of the things men do are morally incorrect | 0.783 |
There are a lot of bad interpersonal behaviors men do that women almost never do | 0.558 |
I often find myself realizing that a man I thought was good is just like the rest | 0.643 |
I do not have many male friends | 0.430 |
Men expect too much from women, but don’t even provide the bare minimum | 0.789 |
A lot of the behaviors men do (like hitting things, wanting to have sex on the first date) are red flags that they want to use or abuse you | 0.571 |
Interacting with ugly or weird men annoys me | 0.464 |
Male ingroup bias - This scale measured male ingroup bias, including cynical generalizations about female behavior, exaggerated perceptions of undesirable characteristics in women, tendency to see women as alien and inferior, annoyance from interacting with women, liking to make fun of women, etc. All items loaded highly on the extracted component [Table 7]. Component scores were used in the analyses.
Table 7
There are hardly any good women in this generation | 0.749 |
Women are lazy but want more compensation | 0.735 |
Most women think they deserve a husband who is a millionaire | 0.601 |
A lot of women think too highly of themselves | 0.771 |
When I talk to a women, I feel like the level of understanding between us is lower than if I were talking with a man | 0.666 |
I mostly have male friends | 0.426 |
I like seeing dumb women get put in their place | 0.722 |
I like making jokes about women | 0.670 |
Most of the women around me are pretty unintelligent | 0.754 |
Most women are promiscuous and give up their body for anyone | 0.819 |
I don’t see a problem with criticizing women for their appearance | 0.750 |
Women in the same occupations or skilled activities as me usually aren’t as good as the men | 0.666 |
Women are generally incapable of real love | 0.778 |
Women expect too much but don’t bring anything to the table | 0.863 |
Religious ingroup bias - This scale measured religious ingroup bias, such as the degree to which people want others to follow their religion, are annoyed by people who don’t follow their religion, the tendency to see people who don’t follow their religion as inferior and alien, etc. All items loaded highly on the scale. Component scores were used in the analyses. [Table 8].
Table 8
Most of the people I am friends with follow my religion | 0.443 |
I am annoyed with people who don’t follow my religion | 0.838 |
When I talk to someone who doesn’t follow my religion, I feel like we are not on the same level of understanding | 0.513 |
It is important that my kids are religious and follow religious values | 0.852 |
I want to spread my religion as much as possible | 0.842 |
People who don’t follow my religion need to be saved | 0.667 |
Traditionalism - This scale measured traditional attitudes, such as negative attitudes to homosexuality and non-monogamy, support for following gender roles, support for traditional hierarchies, etc. All items loaded in the expected direction on the scale. Component scores were used in the analyses. [Table 9]
Table 9
Homosexuality is wrong | 0.754 |
Boys should act like boys, and girls should act like girls | 0.764 |
Certain genres of music are stupid and promote immorality | 0.784 |
Older people generally know better and are smarter | 0.438 |
A parent should have control over their kids | 0.573 |
People should wait until marriage to have sex | 0.801 |
Polyamory (dating relationships with more than 2 people involved) is wrong | 0.698 |
People should dress nicely | 0.640 |
{reverse} Traditions are worthless on their own | 0.373 |
Conservative authoritarianism - This scale measured the degree to which someone wanted to enforce traditional behavior and values. All items loaded highly on the extracted component. Component scores were used in the analyses [Table 10]
Table 10
Homosexuality should be illegal | 0.579 |
Drug use should be illegal and law enforcement should work hard to stop the flow of drugs | 0.694 |
Immigration should be strongly limited | 0.688 |
Abortion should be illegal | 0.500 |
It's important to maintain law & order | 0.668 |
I support the death penalty. | 0.648 |
It should be illegal to burn the national flag. | 0.609 |
My country should maintain a strong military | 0.740 |
Fascist values - This scale measured endorsement of fascist values, all items loaded highly on the scale. Component scores were used in the analyses [Table 11]
Table 11
Without a strong authority, the morality of a society will decay. | 0.699 |
Humans cannot handle true freedom. | 0.694 |
Democracy is flawed in that most people are not intelligent or educated enough to make decisions for society. | 0.617 |
Different races will never be able to settle their differences, so they should be separated. | 0.561 |
One of the most important things for children to learn is discipline. | 0.701 |
Hierarchy is natural. | 0.849 |
There are strong men and weak men. | 0.763 |
War is simply a product of human nature, and is not a bad thing | 0.647 |
Discipline and strength are what the youth need most. | 0.783 |
People learn and grow through hardship and suffering. | 0.668 |
Environmental authoritarianism & Nature appreciation - The environmental authoritarianism scale measured desires to enforce environmentalist policies, and negative attitudes towards people who do not agree with them. The nature appreciation scale measured empathy and appreciation for animals and nature. Varimax rotated factor analysis was used to confirm their separation, which was confirmed, and the factor scores were used in the analyses. [Table 12]
Table 12
| Env Auth | Nature |
Animals should have the same rights as humans | 0.616 | -0.033 |
It should be a top priority of governments to protect the environment, even if it requires massive lifestyle changes | 0.580 | 0.029 |
Those who eat meat but claim to like animals are hypocrites | 0.383 | 0.131 |
Animal testing should be banned | 0.714 | -0.231 |
The existence of zoos should be abolished except for preserving species | 0.562 | -0.014 |
People that kill bugs are stupid and mean | 0.563 | 0.324 |
I feel connected to nature | -0.036 | 0.798 |
I am fascinated by animals | -0.068 | 0.644 |
Nature is very beautiful | 0.304 | 0.511 |
I feel more empathy for animals than most typically do | 0.643 | 0.458 |
It is a bit upsetting when someone kills a bug | 0.724 | 0.186 |
I don’t like to tease animals | 0.378 | 0.526 |
Gender diagnosticity - This scale measured masculinity-femininity though items that tend to have large sex differences, this scale was validated through principal components analysis, most items loading in the expected direction, and actual assigned gender at birth was the highest loading item on the component, the component scores used in the analyses [Table 13]. A second factor was suggested by the scree plot, however it was uninterpretable and did not correlate with biological sex, so it was discarded.
Table 13
I like to watch or play sports | -0.438 |
I am friends with more men than women | -0.654 |
I am interested in technical subjects (e.g., computers, ai, crypto, trains, cars, machines, systems) | -0.604 |
I am willing to do dangerous jobs | -0.676 |
I enjoy a good fight | -0.516 |
I would consider having sex with a stranger if they were attractive and it was safe | -0.327 |
{reverse} I typically cry at least once per week | -0.443 |
My job or major has mostly male coworkers (neutral if no job or major) | -0.331 |
{reverse} I often feel a strong desire to have children | 0.399 |
{reverse} I usually wear makeup | -0.595 |
{reverse} I like to call my friends often | -0.096 |
{reverse} I enjoy making food | 0.029 |
I’m not very scared of horror movies | -0.562 |
If I had a child and only had one, I would prefer it to be male | -0.707 |
{reverse} Maintaining my physical appearance is important to me | -0.376 |
{reverse} I would like to do volunteering work | -0.053 |
{reverse} I enjoy or like to make visual art, poetry, or dioramas | -0.212 |
I enjoy or like to make music, models, or comedic things | -0.171 |
Born female | 0.736 |
Intelligence proxy - This scale intended to measure intelligence without administering cognitive tests, using known correlates of IQ. This scale was validated through principal components analysis, nearly all items loading in the expected direction [Table 14], and correlating highly with openness. These sorts of scales have been used to estimate a person's intelligence prior to a brain injury. Two factors were attempted to be extracted for verbal and spatial intelligence, however the second factor appeared to be unrelated to spatial or verbal IQ, so only the first component was retained. Component scores were used in the analyses.
Table 14
Scientific topics interest me and I find myself searching for information on them | 0.616 |
Most people would describe me as curious and thoughtful | 0.585 |
I know a lot of things that the people around me don’t know much about | 0.655 |
I have taught myself technical skills to a professional level | 0.561 |
I have taught myself artistic skills to a professional level | 0.449 |
I am told I have a good and original sense of humor | 0.456 |
In grade school, I was often the first to finish a test | 0.516 |
I am not offended by words that others are offended by | 0.363 |
I am a bit messy | -0.152 |
I am good at finding connections between things that aren’t obviously related on the surface | 0.616 |
I can often see the intended meanings and overall themes of media without having to think too hard about it | 0.466 |
I spend a lot of my time on creative or intellectual tasks | 0.578 |
I have a good eye for detail | 0.537 |
I can often figure out the meaning of unlabeled depictions of information through pattern recognition | 0.640 |
I can come up with new metaphors | 0.642 |
I have a deep intuitive understanding of many things | 0.840 |
I find people easy to predict | 0.446 |
Mathematics are easy and intuitive for me | 0.271 |
{reverse} I don’t trust science | -0.189 |
My family or extended relatives typically have high paying or interesting jobs | 0.224 |
Most conspiracies seem unlikely, however I am open to possibilities of real conspiracies | 0.169 |
I like people who are unusual or have radical opinions | 0.358 |
I am a bit introverted and “in my head” | -0.164 |
I don’t act out in public and am good at keeping my cool | 0.260 |
I learn about and understand things fairly quickly | 0.690 |
I don’t believe in ghosts | -0.071 |
{reverse} I believe in an afterlife | -0.130 |
{reverse} Astrology can accurately describe many things | 0.043 |
I am good at seeing the big picture and how things all relate below the surface | 0.693 |
I am told to have a good vocabulary | 0.584 |
I articulate myself well | 0.641 |
I did well in school but didn’t study much or pay attention | 0.362 |
{reverse} I never do more than what is expected of me. | 0.243 |
{reverse} I would not like to explore new ideas in a laboratory. | 0.469 |
I change my beliefs about things frequently | -0.058 |
I often find myself criticizing and finding flaws my own ideas and thoughts | 0.200 |
I am good at knowing what people are trying to say when they can’t articulate themselves well | 0.350 |
I can tell how different types of people think and how they may react differently to things | 0.382 |
I pick up things quickly when starting a new job | 0.659 |
I am good at coming up with clever lies | 0.520 |
Rational-Objectivity & Rational-Open mindedness - These variables were derived from a scale I made to assess rationality, that ended up having two factors, one of these relating to desire for objectivity, self awareness, lack of conformity to popular opinion, etc. the other to open minded thinking and acceptance of other perspectives. The oblimin rotated factors were used in the final analyses [Table 15]
Table 15
| Objectivity | Open mind |
{reverse} I think there are many wrong ways, but only one right way, to almost anything | -0.335 | 0.717 |
{reverse} I believe that loyalty to one’s ideals and principles is more important than “open-mindedness”. | 0.079 | 0.601 |
{reverse} I believe letting students hear controversial speakers can only confuse and mislead them. | 0.268 | 0.412 |
{reverse} Certain beliefs are just too important to abandon no matter how good a case can be made against them. | 0.281 | 0.394 |
A person should always consider new possibilities. | 0.082 | 0.668 |
I believe that the different ideas of right and wrong that people in other societies have may be valid for them. | 0.353 | 0.469 |
I can easily identify and accept my flaws and negative traits as well as my positives | 0.574 | -0.058 |
{reverse} I would be offended if someone thought I had a mental illness | -0.242 | 0.732 |
I try hard to be unbiased and objective | 0.714 | 0.048 |
I prefer people to describe things in a factual sense than an impressionistic or opinionated sense | 0.416 | -0.008 |
I am typically the black sheep in situations where most people are divided on an issue | 0.542 | 0.121 |
I play “devils advocate” | 0.441 | -0.002 |
I am able to solve problems without letting emotion get in the way | 0.822 | -0.128 |
Intuitive Psychology Ability - This scale was made to assess the degree to which a person accurately answers questions related to correlations between psychological traits and behaviors in line with empirical findings. Principal components analysis resulted in factors that did not align with the scale (items loading in opposite directions) - it was concluded that PCA would not accurately assess the validity as there are heavy personal and political motivations for answering the items in a way that agrees with their worldview (for example, the first factor had very strong loadings on items relating to sex differences). The scale was instead validated through measuring correlations between the scale and the Tromso Social Intelligence Scale - the total score of the scale correlated highly with the social intelligence scale (except social skills, which relates to behavioral social competence and not cognitive empathy) and negatively with autism (Raads-14 and Literal Language Scale), and each of the items except one had small correlations with social intelligence scales and negative with autism scales (some had negative correlations with the social skills scale, however the social skills scale does not much relate to cognitive empathy). The total scale scores were used in the analysis. [Table 16]
Table 16
| Social Information Processing | Social Skills | Social Awareness | Raads-14 | Literal Language |
{reverse} Intelligent people typically go to bed earlier | 0.25 | 0.01 | 0.08 | -0.12 | -0.15 |
{reverse} People who are transgender tend to be more socially skilled | 0.06 | -0.01 | 0.08 | -0.12 | -0.08 |
{reverse} Women tend to be more impulsive and make poorer long term decisions | 0.23 | -0.02 | 0.28 | -0.05 | -0.08 |
Women are often attracted to popularity in men | 0.06 | 0.02 | 0.00 | -0.16 | -0.08 |
{reverse} People from rural areas outside of cities are more prone to schizophrenia | 0.34 | 0.05 | 0.39 | -0.22 | -0.30 |
{reverse} People who are highly into sports are typically introverted | 0.19 | -0.18 | 0.14 | 0.06 | -0.03 |
{reverse} The music genres people listen to do not predict their personality | 0.18 | -0.22 | 0.24 | -0.31 | -0.32 |
{reverse} Women tend to be more promiscuous than men | 0.22 | 0.06 | 0.32 | -0.13 | -0.12 |
{reverse} Smart people typically don’t have a good fashion sense | 0.11 | 0.26 | 0.31 | -0.02 | 0.02 |
{reverse} Women have higher standards for physical attractiveness than men | 0.17 | 0.11 | 0.29 | -0.04 | -0.09 |
{reverse} Musicians are typically precise and orderly | 0.21 | 0.12 | 0.25 | -0.17 | -0.21 |
Most people have some symptoms of mental illness that affect their personality | -0.06 | -0.12 | -0.38 | 0.24 | 0.26 |
Women tend to be more attached to their caregivers | 0.11 | -0.15 | -0.03 | -0.08 | -0.04 |
{reverse} Magicians are more likely to have unusual beliefs and odd sensory experiences | 0.12 | 0.03 | 0.09 | -0.08 | -0.06 |
Comedians tend to be impulsive and introverted | 0.12 | 0.06 | -0.04 | -0.14 | -0.15 |
Masculine women are more promiscuous | 0.16 | -0.12 | -0.07 | -0.16 | -0.22 |
{reverse} Gamers are typically more socially skilled | 0.15 | 0.07 | 0.11 | -0.12 | -0.17 |
{reverse} Open mindedness is typically highest in early childhood and old age | -0.07 | 0.00 | 0.09 | -0.14 | -0.10 |
{reverse} Poor handwriting is an indicator of low intelligence | 0.08 | -0.18 | 0.16 | 0.03 | -0.14 |
{reverse} Logic and empathy are typically opposing forces on thinking | 0.10 | -0.04 | 0.25 | -0.13 | -0.12 |
Intuitive Psychology Ability | 0.48 | -0.02 | 0.46 | -0.35 | -0.39 |
Xenophobia - This scale was made to assess cultural and racial ingroup bias, all items loaded highly on the extracted component, which was used in the analyses [Table 17]
Table 17
When I go into a business and see many foreigners working there, I feel a little irritated | 0.863 |
The idea of dating someone outside of my race makes me uncomfortable | 0.541 |
Most other cultures are stupid or morally wrong | 0.768 |
I often feel a sense of distrust and angry toward people of a race of someone that did something bad | 0.848 |
A lot of accents and the sound of other languages annoy me | 0.657 |
When I hear people talking in a language I don’t speak, I am suspicious of what they are talking about | 0.679 |
Foreigners typically are loyal to their home countries and will betray the one they immigrated to | 0.822 |
Social liberalism - This scale was used to measure socially liberal attitudes (“Drug use should be decriminalized”, “Any sexual orientation is fine as long as it doesn’t harm anyone”, “Free speech should be guaranteed”), all items loaded in the expected direction on the extracted component, component scores were used in the analyses. [Table 18]
Table 18
People who want to express their gender in an atypical way should not be judged | 0.846 |
All sexual orientations are fine, as long as they don’t harm anyone | 0.793 |
Women shouldn’t have to wear shirts or bras in public if they don’t want to | 0.397 |
Everyone should be treated equally and individually | 0.775 |
Drug use should be decriminalized | 0.725 |
The government should not spy on its citizens | 0.403 |
Different lifestyles are valid and should be accepted | 0.823 |
Juries should be able to judge the validity of laws themselves | 0.292 |
Freedom of speech should be guaranteed | 0.458 |
Law enforcement should focus on rehabilitation and shouldn’t prosecute victimless crimes | 0.697 |
Selective empathy - This scale was used to measure the degree to which someone is selective in who they empathize with, this scale was validated through PCA, all items loading highly in the same direction, the component scores were used in the analyses [Table 19]
Table 19
I am not upset by the suffering of people who do bad things | 0.782 |
When the opposite sex complains about their problems, I feel like rolling my eyes | 0.609 |
I like seeing people get what they deserve | 0.748 |
Seeing my ex relationship partners doing badly doesn’t upset me | 0.613 |
Generic spirituality & Traditional Spirituality - This variable was extracted from a scale I made to assess spiritual beliefs, which ended up having two factors, generic spirituality relating to things like belief in souls, reincarnation, and astrology, traditional relating to traditional spiritual ideas like belief in god, creation, and an afterlife [Table 20]. Oblimin rotated scores were used in the analyses.
Table 20
| Generic | Traditional |
There is an afterlife | 0.875 | 0.072 |
Humans have souls | 0.538 | 0.396 |
Consciousness lasts beyond the grave | 0.707 | 0.296 |
Reincarnation is likely true | 0.171 | 0.773 |
Astrology accurately explains many things | -0.088 | 0.884 |
There are supernatural, all powerful entities that exist | 0.827 | 0.081 |
The universe was created by an entity | 0.947 | -0.320 |
Sexual disgust - This scale came from previous unpublished studies, measuring a person's sensitivity to sexual disgust, as in previous studies with this scale, all items loaded highly in the expected direction on the extracted principal component, and the component scores were used in the analysis. [Table 21]
Table 21
People who watch porn are disgusting | 0.669 |
Many common sexual practices are disgusting and should stop | 0.813 |
People who enjoy casual sex are disgusting | 0.755 |
Society pressures people to be unnaturally sexual | 0.695 |
It is not natural for minors to have sexual desires | 0.415 |
Most sexual fetishes are unnatural, disgusting, and caused by porn addiction or trauma | 0.801 |
People should not talk about their sex life casually | 0.698 |
Economic Libertarianism/Support for Markets - This scale was made to measure libertarian and pro-market economic attitudes. All items loaded highly in the expected direction [Table 22]. Component scores were used in the analysis
Table 22
Free trade is essential for a prosperous economy | 0.851 |
Anyone should be able to open a business without having to go through all the hassle | 0.814 |
Competition in the market leads to better products and practices | 0.668 |
There should be little restrictions on who can sell, what they can sell, who they can sell too, etc | 0.800 |
Economic egalitarianism - This scale measured attitudes in support of economic egalitarianism (i.e., reducing inequality). All items loaded highly, the component scores were used in the analysis [Table 23]
Table 23
Welfare programs are a necessity | 0.701 |
{reverse} Social programs to help the poor are usually just abused | 0.531 |
The rich ought to help the poor | 0.645 |
Everyone deserves a decent standard of living | 0.794 |
Even if someone doesn’t contribute much to society, they should be afforded the basic necessities and quality of living | 0.783 |
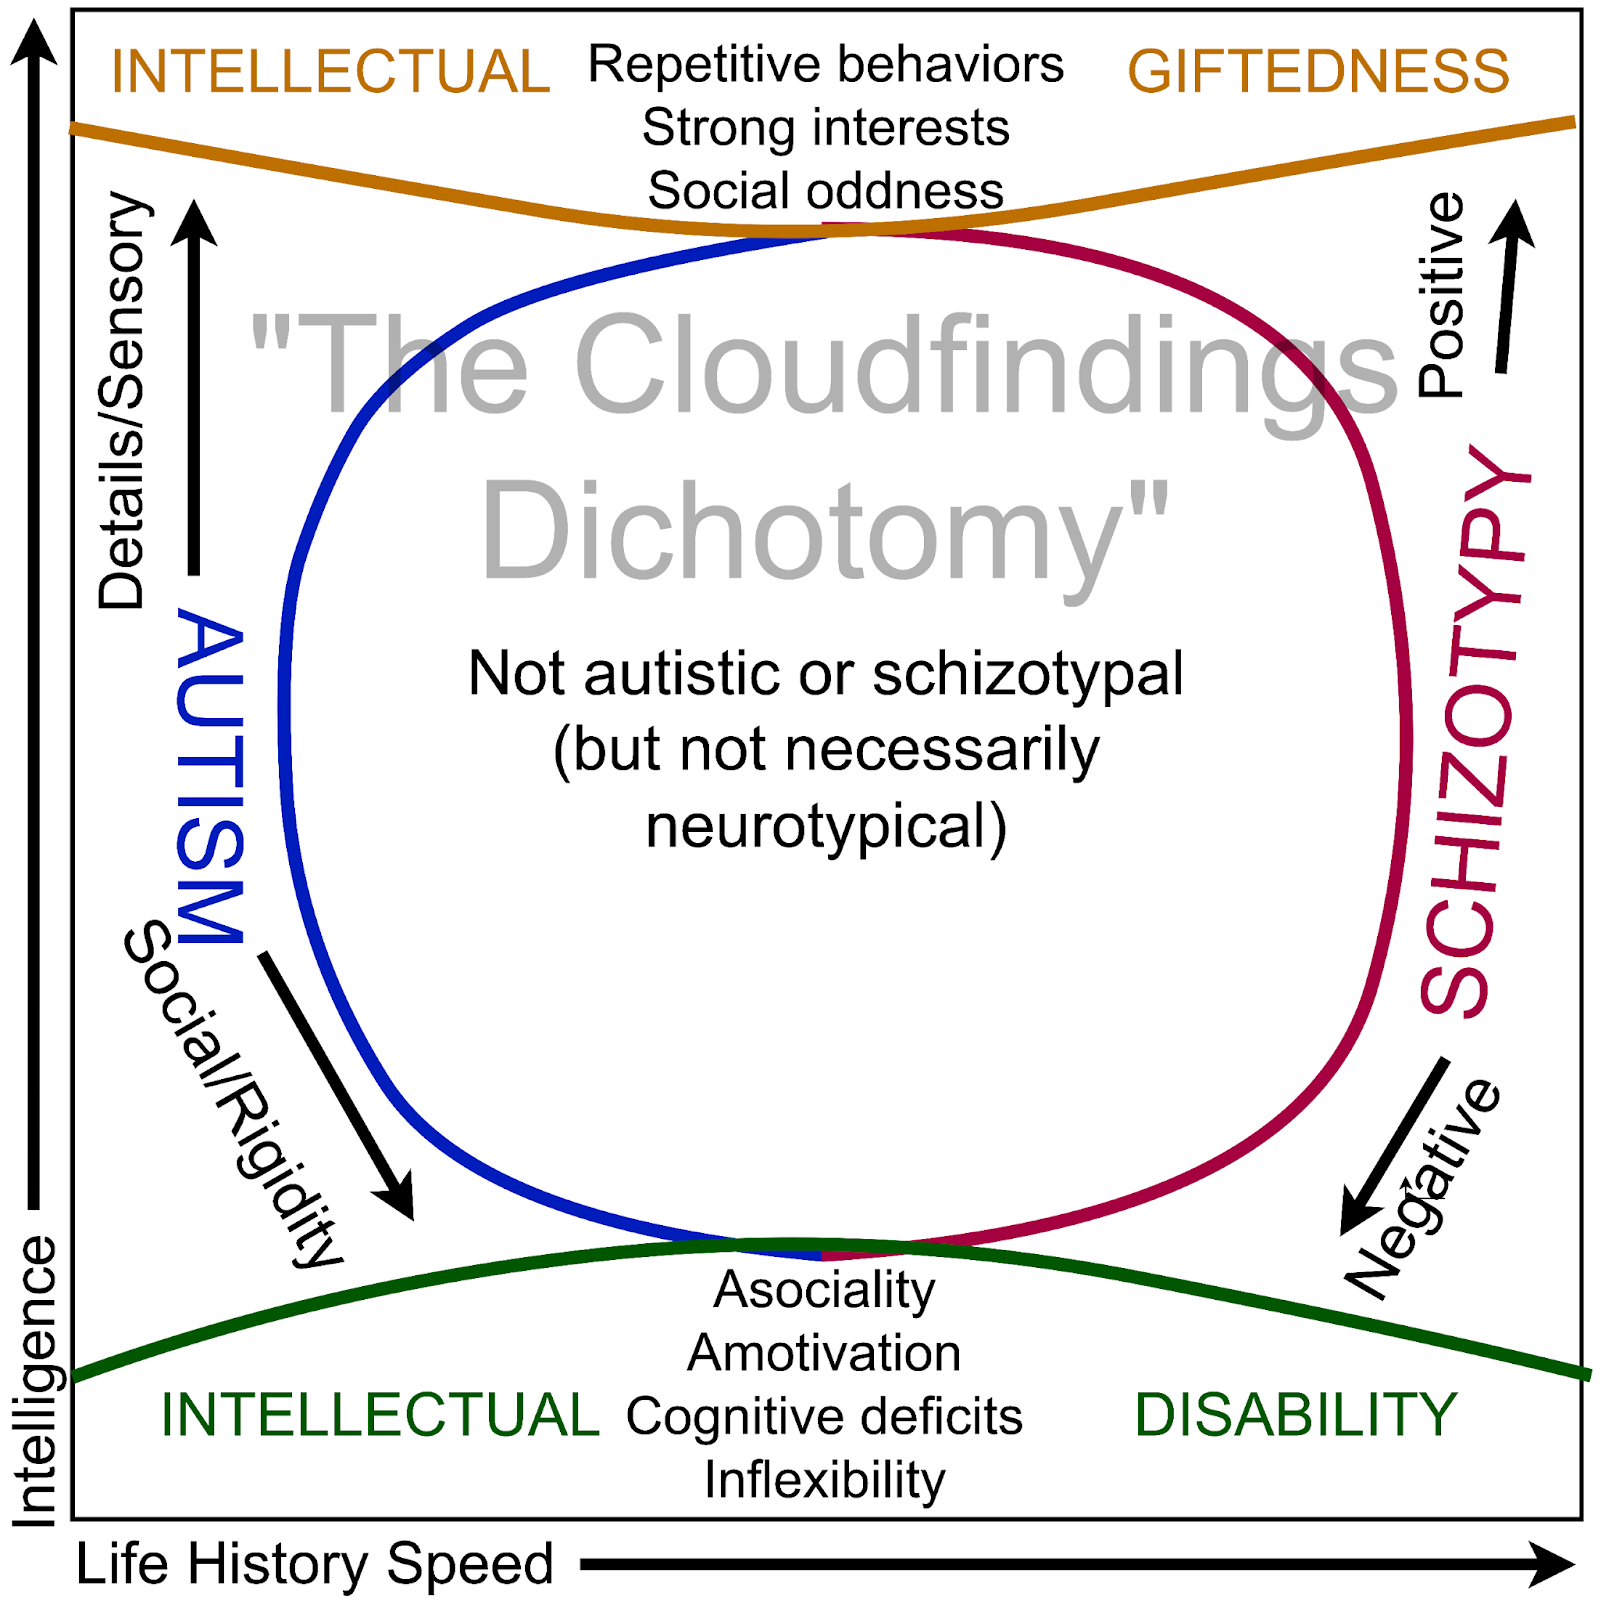
Schizotypy-Autism and Social Difficulty - These were extracted components from the schizotypy and autism scales, which have been used in studies on autistic and schizotypal traits (Nenadic et al. 2021). The diametric structure was replicated as expected [Table 24]
Table 24
| Soc. Diff | Schizo-Aut |
Literal language | 0.866 | -0.264 |
Autistic interests | 0.672 | -0.426 |
RAADS-14 | 0.868 | -0.203 |
Disorganized schizotypy | 0.552 | 0.468 |
Impulsive nonconformity | 0.458 | 0.715 |
Unusual experiences | 0.140 | 0.758 |
Results
A PCA was conducted of all the variables in the study. When not rotated, PC1 corresponded to a clear dimension of traditionalism versus progressivism, and PC2 to a dimension of intellectualism vs anti-intellectualism. When rotated 45 degrees (manual orthogonal rotation of factor loadings), the first component corresponded to the hypothesized Cognitive empathy vs Moral absolutism dimension, and the second to the hypothesized Feminine-Egalitarian vs Masculine-Hierarchical dimension. [Table 25] [Figure 1]
| Trad | Anti-Intellect | Cog. Empathy | Masc-Hierarchy |
Humanism/Unconditional empathy | -0.184 | -0.464 | 0.483 | 0.126 |
Moral Absolutism | 0.634 | 0.468 | -0.753 | 0.234 |
Male ingroup bias | 0.755 | -0.301 | -0.205 | 0.787 |
General disgust | 0.206 | 0.725 | -0.707 | -0.263 |
Ostracism/Disgust of Non-conformity | 0.017 | 0.836 | -0.684 | -0.481 |
Bullying of Disgust & Nonconformity | 0.764 | 0.066 | -0.505 | 0.577 |
Political Correctness | -0.478 | 0.700 | -0.281 | -0.800 |
Female ingroup bias | 0.002 | 0.720 | -0.581 | -0.424 |
Religious Ingroup bias | 0.748 | 0.047 | -0.481 | 0.575 |
Traditionalism | 0.860 | 0.022 | -0.527 | 0.681 |
Conservative Authoritarianism | 0.833 | -0.156 | -0.367 | 0.763 |
Fascist Values | 0.777 | -0.160 | -0.331 | 0.721 |
Free market | -0.056 | -0.275 | 0.255 | 0.118 |
Economic egalitarian | -0.477 | 0.470 | -0.097 | -0.663 |
Environment authoritarianism | -0.011 | 0.710 | -0.566 | -0.429 |
Environment appreciation | 0.145 | -0.217 | 0.089 | 0.245 |
Sexual disgust | 0.720 | 0.262 | -0.638 | 0.425 |
Femininity | -0.398 | 0.566 | -0.221 | -0.656 |
Intelligence | 0.080 | -0.557 | 0.402 | 0.394 |
Rational-Objectivity | -0.059 | -0.667 | 0.573 | 0.347 |
Rational-Open Mindedness | -0.629 | -0.296 | 0.611 | -0.332 |
Intuitive psychology ability | -0.388 | -0.332 | 0.497 | -0.116 |
Emotional empathy | -0.012 | 0.247 | -0.192 | -0.156 |
Social Difficulty | 0.227 | 0.386 | -0.445 | -0.045 |
Schizotypy (vs autism) | -0.077 | -0.296 | 0.284 | 0.113 |
Xenophobia | 0.738 | 0.006 | -0.442 | 0.592 |
Social liberalism | -0.815 | 0.087 | 0.413 | -0.709 |
Selective empathy | 0.384 | 0.297 | -0.466 | 0.134 |
Traditional Spirituality | 0.569 | -0.008 | -0.331 | 0.463 |
Generic Spirituality | -0.025 | 0.251 | -0.187 | -0.169 |
Social information processing | -0.187 | -0.346 | 0.389 | 0.054 |
Social skills | -0.158 | -0.114 | 0.185 | -0.060 |
Social awareness | -0.326 | -0.403 | 0.517 | -0.024 |
P. Psychopathy | 0.166 | -0.312 | 0.154 | 0.319 |
S. Psychopathy | -0.043 | 0.033 | -0.001 | -0.054 |
OcPD | 0.452 | 0.308 | -0.516 | 0.182 |
OCD | 0.165 | 0.433 | -0.447 | -0.123 |
Harm | -0.236 | 0.467 | -0.236 | -0.467 |
Fairness | -0.341 | 0.562 | -0.251 | -0.607 |
Ingroup | 0.670 | -0.142 | -0.283 | 0.624 |
Authority | 0.602 | -0.108 | -0.270 | 0.549 |
Purity | 0.805 | 0.140 | -0.589 | 0.566 |
Extraversion | -0.254 | 0.172 | 0.011 | -0.306 |
Agreeableness | -0.208 | 0.169 | -0.013 | -0.268 |
Conscientiousness | 0.129 | 0.017 | -0.090 | 0.094 |
Emotional stability | -0.024 | -0.391 | 0.329 | 0.213 |
Openness | -0.276 | -0.144 | 0.280 | -0.137 |
Figure 1

1. Silvera et al. (2001) The Tromsø Social Intelligence Scale, a self-report measure of social intelligence
2. Davis (1980) A multidimensional approach to individual differences in empathy
3. Levenson et al. (1995) Assessing psychopathic attributes in a noninstitutionalized population
4. Eriksson et al. (2013) RAADS-14 Screen: validity of a screening tool for autism spectrum disorder in an adult psychiatric population
5. Mason et al. (2005) Short scales for measuring schizotypy
6. Cohen et al. (2013) Toward a more psychometrically sound brief measure of schizotypal traits: introducing the SPQ-Brief Revised
7. Storch et al. (2010) Assessment of obsessive-compulsive symptom dimensions: development and evaluation of the Dimensional Obsessive-Compulsive Scale
8. Gosling et al. (2003) A very brief measure of the Big-Five Personality Domains
9. Graham et al. (2009) Liberals and conservatives rely on different sets of moral foundations
10. Cloudfindings (2021) Literal Language Scale: Development & Association With Social Intelligence
11. Cloudfindings (2022a) Characterizing Repetitive Behaviors & Interests Specific to Autism: The Autistic Interests Scale
12. Cloudfindings (2022b) Obsessive Compulsive Personality Disorder as an Autism Spectrum Disorder
13. Nenadic et al. (2021) Subclinical schizotypal vs. autistic traits show overlapping and diametrically opposed facets in a non-clinical population
14. Cloudfindings (2024) The True Political Compass: A Hypothesis of the Underlying Psychology of Political Orientations
15. Stoet (2010). PsyToolkit - A software package for programming psychological experiments using Linux.
16. Stoet (2017). PsyToolkit: A novel web-based method for running online questionnaires and reaction-time experiments

Comments
Post a Comment